

2008 R&I Beverage Census: Good Libations – US Food Trends

Any economic downturn spells bad news for foodservice, but historically, beverage sales- especially alcohol- have proven blissfully immune to the country's financial woes. Now that consumers face unprecedented uncertainty about their financial security, have the rules changed?
This article first appeared in the 1 November 2008 issue of Restaurants & Institutions (R&I).
R&I is the USA's leading source of food and business-trend information and exclusive research on operators and restaurant patrons. Editorial coverage spans the entire foodservice industry, including chains, independent restaurants, hotels and institutions. Visit the R&I website to find out more about the magazine or to search its recipe database.
By Allison Perlik, Senior Editor
R&I's findings provide more details on how the economy is taking its toll. More than half of operators (55%) raised prices on nonalcoholic beverages in the past year, while 66% hiked prices on alcoholic drinks. Meanwhile, 14% ramped up pricing specials on nonalcoholic drinks-these figures rise to 20% for limited-service restaurants and 25% for chains overall-and 34% are offering more specials on alcoholic choices.
So where do the opportunities lie amid Beverage Census' facts and figures? Delving into the data reveals how much profit potential exists in beverages these days and where foodservice operators can find it. The exclusive survey, conducted in September among representative samples of 845 consumers and 809 operators, details not just what kinds of beverages operators are menuing and where they're having success, but also what consumers buy most-and what they'd like to see more.
Why Drinks Matter
At any time, but especially amid a faltering economy, focusing on beverage sales is a smart strategy since the majority of dining experiences include drink orders. On average, consumers buy nonalcoholic drinks 68% of the time when dining out. They order alcoholic drinks 17% of the time on average, a number that grows to nearly 20% for Americans earning $50,000 a year or more and to 23% among Gen-Y diners.
Even more important for operators, beverages, in general, account for a hefty slice of sales and in many cases-most notably, fountain drinks and alcohol-offer more-attractive profit margins than just about anything else in foodservice.
Nonalcoholic drinks comprise 17% of sales on average; they represent a larger percentage for noncommercial (25%) and limited-service concepts (20%) than for full-service restaurants (12%). Alcoholic drinks, meanwhile, account for an average 12% of sales overall, trending much higher in fine dining (25%), lodging (23%) and casual dining (20%).
Sales Trends: What's Ahead
While alcohol sales are following their historical pattern of being somewhat recession proof, the new wrinkle is that this time around, Americans are boosting spending on beer, wine and cocktails at home rather than at restaurants. Growth in retail sales of alcohol for at-home consumption outpaced on-premise growth this year, with an estimated 3.5% increase (at inflation-adjusted prices) in retail sales versus a 3% decline in sales at eating places, reports Chicago-based researcher Mintel International. Mintel predicts on-premise sales soon will swing back to the positive side, rising 3% in 2009 and higher in the ensuing years.
Among nonalcoholic choices, carbonated soft drinks still garner the greatest percentage of sales, but per-capita consumption continues to fall, making room for faster-growing nonalcoholic categories such as energy drinks, bottled water and iced tea.
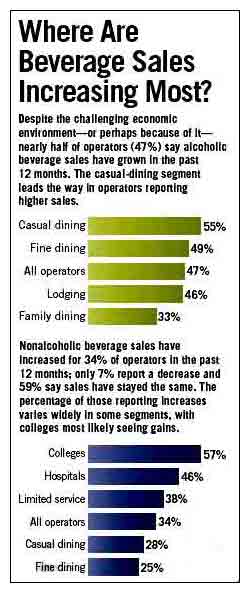
Where Are Beverage Sales Increasing Most?
Despite the challenging economic environment - or perhaps because of it - nearly half of oerators (47%) say alcohol beverage sales have grown in the past 12 months. The casual-dining segment leads the way in operators reporting higher sales.
- Casual dining: 55%
- Fine dining: 49%
- All operators: 47%
- Lodging: 48%
- Family dining: 33%
Non-alcoholic beverage sales have increased for 34% of operators in the past 12 months; only 7% report a decrease and 59% say sales have stayed the same. The percentage of those reporting increases varies widely in some segments, with colleges most likely seeing gains.
- Colleges: 57%
- Hospitals: 46%
- Limited services: 38%
- All operators: 34%
- Casual dining: 28%
- Fine dining: 25%
What Drinks Are Consumers Ordering More - and Less?
In most cases, the percentage of consumers who say they're ordering less of a particular beverage is offset by a comparable number ordering more.
| Less | Drink | More |
| 20% | Coffee | 22% |
| 22%Â | Hot tea | 15% |
| 16% | Iced tea | 24% |
| 25% | Soda/soft drinks | 13% |
| 18% | Juice/ades | 20% |
| 21% | Water  | 25% |
| 21% | Beer  | 19% |
| 16% | Wine  | 21% |
-
In the sections below, R&I breaks down more-detailed sales trends, top selling drinks and up-and-coming menu items by beverage category to help operators grab their share of this profit potential.
Cocktails & Spirits
The Facts
A full 29% of consumers report ordering less liquor and cocktails than last year, particularly those earning under $20,000 (49%). Another 18% overall say they're ordering more liquor and cocktails, but the percentage grows among Gen Y (39%) and residents of the Northeast (30%).
The types of liquor found on fine-dining menus offer cues about what's hot: 83% of these operators say they serve flavored vodkas, 63% flavored rums, 44% bitters, 27% house-infused spirits, 24% cachaÁ§a and 21% absinthe.
Liquors that consumers say they would order but don't typically see on menus include flavored vodkas and rums, cordials and absinthe.
Cost is the greatest motivator among consumers who say they've ordered less liquor and cocktails in the past six months; a preference for other beverages is the next most-common reason.
Beer & Wine
While 19% of consumers overall are ordering more beer than a year ago, this percentage climbs to 40% for Gen Y, 35% for those earning less than $20,000 a year and 28% for Northeastern residents.
The Facts: Beer
While 19% of consumers overall are ordering more beer than a year ago, this percentage climbs to 40% for Gen Y, 35% for those earning less than $20,000 a year and 28% for Northeastern residents.
Overall, 21% are ordering less beer, especially women (27%), Gen X (27%) and those living in the West (31%).
Notable beer categories operators say are increasing in sales include microbrew tap and bottled beers (for 22% and 21% of operators, respectively), imported bottles and tap beer (25% and 21%, respectively) and seasonal brews (14%).
Among beers consumers would like to order more but don't typically see on menus are seasonal brews, flavored beers, organic beers and flights.
For both beer and wine, cost is the biggest reason among customers who say they're ordering less often, but the expense factors much more into wine orders than beer.
The Facts: Wine
Overall, 21% of consumers are ordering more wine than they did a year ago, including 39% of Gen-Y diners and 29% of Gen-X diners; 16% of consumers are ordering less wine.
Overall, domestic white wines just edge domestic reds among operators' top sellers, but red wines slightly outpace whites when it comes to increasing sales.
Women, matures and diners earning $35,000 per year or more are significantly more likely to order wine by the glass than other consumers.
In fine dining, perhaps best illustrative of up-and-coming trends, domestic reds and whites are increasing in sales most (for 36% and 29% of operators, respectively), followed by imported reds (26%), champagne and sparkling wine (16%), imported whites (14%), imported rosés (13%) and half-bottles (11%).
Among wines consumers would order but don't typically see on menus are organic, champagne and sparkling wine, imported white wines and sake
Trend to Note
Consumer interest in bubbly drinks is escalating. 12% have ordered Champagne and sparkling wine more often in the last six months (31% for Gen Y), while 11% have ordered Champagne cocktails (nearly 20% for Gen Y and Gen X). Italian restaurant All'Angelo in Los Angelese is taking advantage with its new Spritz Bar, an area at the front of the restaurant where customers can order an array of cocktails and by-the-glass choices featuring sparkling wines.
Where are the Wine Hotspots?
Operators rank the Top 10 up-and-coming wine regions.
- Amercian Region
- Chile
- Australia
- South Africa
- New Zealand
- Spain
- Italy
- France
- Other
- Greece
Soft Drinks & Smoothies
One-quarter of consumers report ordering fewer soft drinks than last year. Just 13% overall are ordering more, but these numbers climb to 28% for Gen Y and 25% among those earning less than $35,000 per year.
The Facts
One-quarter of consumers report ordering fewer soft drinks than last year. Just 13% overall are ordering more, but these numbers climb to 28% for Gen Y and 25% among those earning less than $35,000 per year.
Health concerns are the top reason why consumers say they are ordering fewer soft drinks, followed by diet concerns and then expense.
In the last six months, consumers are slightly more likely to have ordered fountain drinks than bottled sodas or cans.
The buying habits and interests of Gen-Y diners, often significantly different from other age groups, offer a useful barometer of trends to come. In the past six months a substantial number of Gen-Y consumers have ordered energy drinks (22%), sports drinks (19%), specialty-brand sodas (11%) and nonalcoholic cocktails (11%).
Correspondingly, among beverages operators plan to add are energy drinks, sports drinks, vitamin-enhanced sodas, organic sodas and specialty-brand sodas.
Boomers and matures are significantly more likely to order diet colas than younger diners.
More than one-third of consumers have ordered smoothies in the past six months. Gen Y is much more likely than other age groups to buy smoothies: 64% have done so in the past six months compared to 41% of Gen X, 24% of boomers and 14% of matures.
Smoothies are more popular in the Northeast and West, where 43% and 42% of consumers, respectively, have purchased them in the last six months compared to 27% in the Midwest and 29% in the South.
Ideas at Work: Snappy Salads
Two-and-a-half years after launching fast-casual concept Snappy Salads in Dallas, Founder and President Chris Dahlander decided the restaurant's natural slant should also be reflectged in the beverage line-up. this summer, he replaced his regular cola offerings with all-natural cola, diet cola and root beer sweetened with cane sugar. He also introduced a line of functional bottled drinks.
Overall, about 40% of beverage sales the two Snappy Salads units come from bottled water (still and sparkling). While all the bottled drinks carry lower margins than fountain beverages, Dahlander notes, they still yield healthy profits. To spur sales of new products, employees offer samples of any drink.
Every customer that comes in gets a beverage sales pitch. "It's an upsell. If you say, "Would you like anything to drink?" people can just say, "Nope." But if you say, "Would you like an organic black iced tea or a lemonade?", people think differently," says Dahlander, noting that it's harder for them to say no to a very specific item.
Trend to note
The recently introduced line of coffee-based smoothies from Covington, La.-based Smoothie King captures two key beverage trends. More than on-third of consumers overall and 64% of Gen-y diners have ordered smoothies in the past six months, while 19% overall and 46% of Gen-Y diners have purchased iced coffee. The energy-boosting smoothies also fit right in with consumers' interest in functional drinks.
Tea & Coffee
About one-fifth of consumers overall are ordering more coffee than last year.
The Facts: Tea Nearly one-quarter of consumers are ordering more iced tea than last year while 15% are ordering more hot tea; Gen Y and Gen X are much more likely to say they are ordering more of each.
The same percentage of diners, 28%, have ordered unsweetened and sweetened iced teas more often in the past six months. Other varieties that consumers are generally ordering more often are hot or cold green tea and flavored iced tea.
Gen Y is more likely than other demographics to say they are ordering certain tea varieties more often: 19% are buying more green tea, 13% more flavored iced tea, 12% more hot herbal tea and 10% more chai. Gen-Y diners also are much more likely to have ordered sweetened iced tea than unsweetened in the past six months.
The Facts: Coffee
About one-fifth of consumers overall are ordering more coffee than last year. Demographics with higher percentages ordering more coffee include Gen Y (46%), Gen X (33%) and residents of the Northeast (28%). But 20% of diners are ordering less coffee, especially those earning less than $20,000 (33%).
Asked which coffee varieties they are ordering more often, Gen-Y consumers are more likely than other demographics to list cappuccino (35%), iced coffee (33%), lattes (27%), flavored coffee (25%) and espresso (23%).
Gen-Y consumers also are more likely than other groups to have ordered organic or fair-trade coffee in the last six months.
Not surprisingly, colleges tend to offer more up-and-coming coffee options: 69% sell flavored coffee, 62% offer fair-trade coffee, 60% serve iced coffee and coffee drinks (60%) and 38% sell organic coffee.
Health concerns are second to cost among the reasons people are drinking less coffee with meals; those ordering less tea cite a preference for other drinks as their top reason.
Trend to note
Not only do seasonal drinks score big with consumers, but in times of economic distress, Americans cherish affordable indulgence even more. Given that 33% of consumers have ordered hot chocolate in the past six months (including 47% of Gen-Y diners), Seattle-based Starbucks may be right on target with its recently-introduced line of Signature Hot Chocolate.
Name game 39% percent of consumers say they'd be more likely to order coffee at restaurants if known brands such as Starbucks, Caribou Coffee and Tim Hortopns were available (R&I 2008 Beverage Census)
Water
One-quarter of consumers say they are ordering more water than they did last year, especially Gen Y (46%); 21% are ordering less.
The Facts
One-quarter of consumers say they are ordering more water than they did last year, especially Gen Y (46%); 21% are ordering less.
A majority (62%) of operators menu bottled still water, most often in fine dining (81%), lodging, (81%) and on campuses (76%).
Among the types of water diners were ordering more often in the last six months are bottled still water (37%), bottled sparkling water (12%), vitamin-enhanced water (10%) and flavored water (9%). In addition, these all are among the items consumers say they would order but don't typically find on menus.
39% of operators always serve water after seating guests; the rest serve water only on request.
Ideas at Work: Vita Restaurant
At Italian-American restaurant Vita in Atlanta, owner Tony LaRocco recently purchased a water-filtering system and discontinued selling bottled water. The switch saves money and storage space, and the system's high-grade carbon filters and ultraviolet technology also provides what LaRocco views as a more-healthful product.
To encourage sales, he offers free samples, then charges $2 per person for still or sparkling water with free refills.
As the economy keeps more customers from dining out, LaRocco is turning to other beverages to boost sales, too. He now keeps Vita's bar open as late as 2.30 a.m. on weekends, serving the full menu until 1 a.m. The restaurant also holds wine tastings on Tuesdays: $15 per person to sample six wines with snacks.
"Beverages are definitely more important [in this economy]," LaRocco says. "People are [out] drinking more than they're eating."
About the Survey
R&I's 2008 Beverage Census was conducted in September 2008 using Internet surveys completed by 809 purchase decision-makers in 11 market segments (representative by geography and ownership/management type) and 845 consumers who had dined away from home in the past six months (representative by age, geography and income). For more details or to purchase the report, please contact Terri Solomon at (630) 288-8202 or at terri.solomon@reedbusiness.com.


